 We can directly compare groups to find factors or links mentioned more by one group than another using a statistical test to find the most surprising differences between groups, taking into account the underlying frequencies.
Differences - sample#
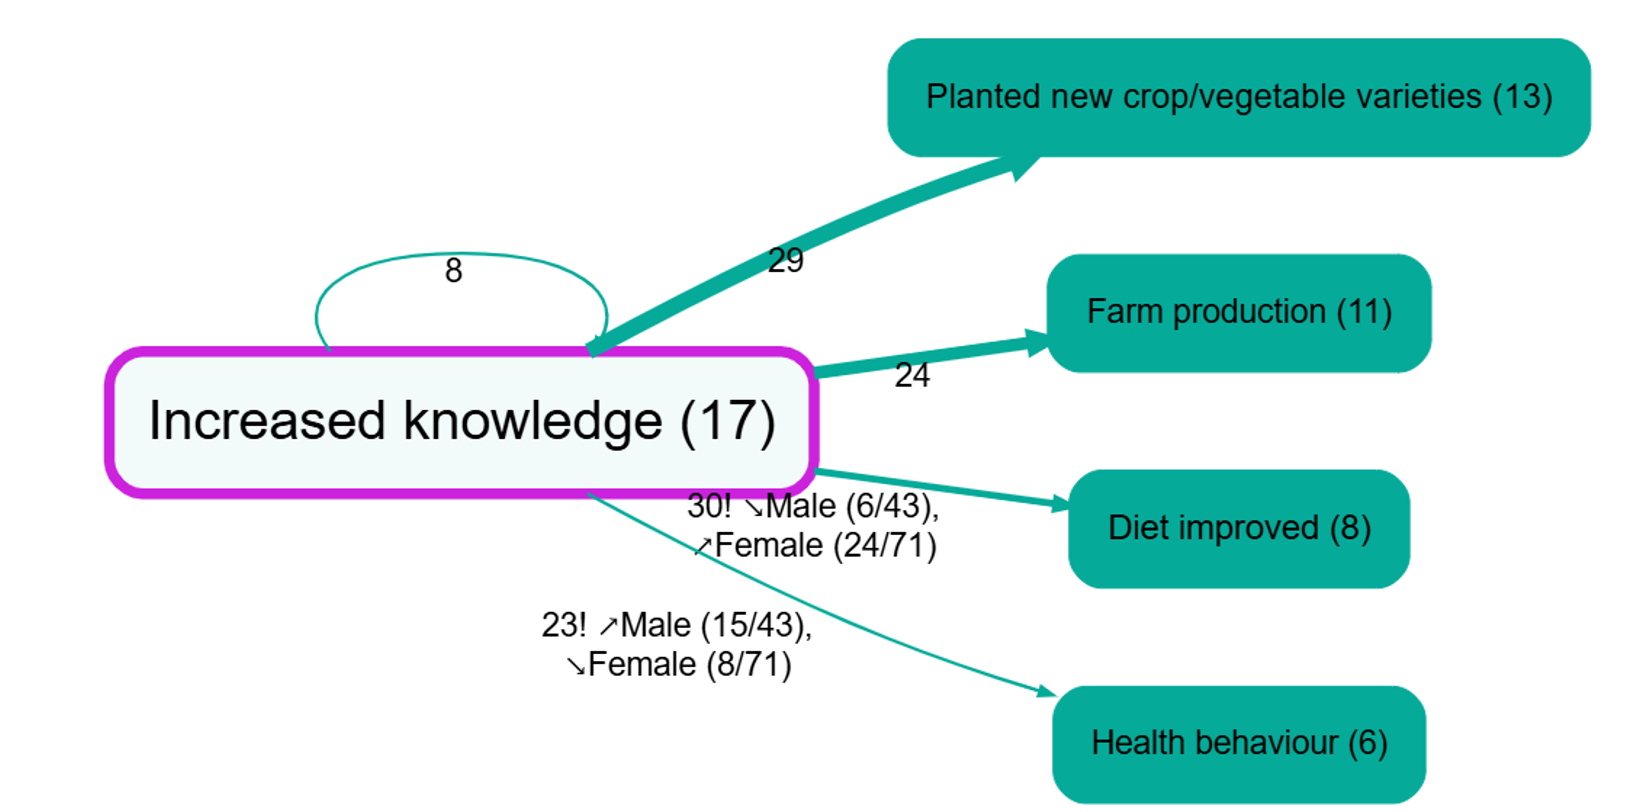
Shows which links were preferentially mentioned according to different groups e.g. women more than men. We ask:
does the proportion of women vs men who mention this link differ from what you would expect (given the total number of mentions of links by both women vs men)?
| Women | Men | |
|---|---|---|
| ... other links ... | ||
| Number of mentions of the link from X to Y | 10 | 9 |
| ... other links ... | ||
| Total number of mentions of any link | 60 | 10 |
In this case we can see that although women mentioned the link slightly more often than men, women altogether mentioned links twice as often as men. So we can compare the number of mentions of the link with the number of "non-mentions" of the link. So we can work out this table (not shown).
| Women | Men | |
|---|---|---|
| Number of mentions of the link from X to Y | 10 | 9 |
| Number of mentions of any other link | 50 | 1 |
We can do a simple chi-squared test on this table to see if the ratio 10:9 is significantly different from 50:1 (which of course it is) — this is the same question as to whether 10:50 is significantly different from 9:1 (which of course it is). If this test is significant, the row "Number of mentions of the link from X to Y" is shown in the table, and the intensity of the colouring of each cell reflects its chi-squared residual, i.e. how different is the number it contains from the number you would expect, given the other numbers?
This comparison is agnostic as to whether there are, say, many men or a few men who talk a lot.
The tests for this are chi-squared tests. If the grouping factor is numerical we add an additional correction for ordinal scale so that the chi-squared test is not weaker than it should be.